
Wednesday, March 10, 2010
System Activity - Detailed Process View Part 3
I've now added basic X11 memory information to System Activity's Detailed Memory Information. It's a bit crude at the moment and simply states the total pixmap memory usage.
System Activity - confusing naming with memory usage
As I've blogged about before, System Activity now has an option to show the detailed memory usage of a process. However the numbers shown there don't match up at all with the numbers shown in the process list. This can be very confusing.
The reason is because the process list shows an approximation, so tends to underestimate the Private memory usage, and overestimate the Shared memory usage. It also doesn't help that it had a different name in the tooltip (URSS etc).
So I've added WhatsThis and tooltips to everything to try to explain the situation, and tried to use consistent naming. Hopefully this help. I've also updated the userbase FAQ.
Please let me know if you have any questions that are not answered on this FAQ. Feel free to use the discussion page there.
Saturday, February 20, 2010
System Activity - Detailed Process View Part 2
I finally came to a design that I'm mostly happy with for how the scripting is done in System Activity. I ended up simplifying the design, removing the QUILoader and the QScriptEngine and just using the QWebView only for the scripting.
The scripting system now looks for an index.html, which would be an html file like:
...
Then javascript inserts the html. This way we can translate the strings, and refresh the data without reloading the screen.
So we can now refresh the data continually. This works, but unfortunately it uses up a lot of CPU :-/ It's disabled for now, but I might add a button to refresh or something.
The scripting system now looks for an index.html, which would be an html file like:
<html>
    <head>
        <link href="style.css" rel="stylesheet" type="text/css">
        <script language="javascript" src="main.js" language="javascript" type="text/javascript">
    </head>
    <body>
        <div id="innertoc" class="innertoc"></div>
        <h1 id="heading"></h1>
        <h2 id="SummaryHeading"></h2>
        <div id="processsummary">
            <!-- The process X is using approximately Y amount of memory etc !-->
        </div>
...
Then javascript inserts the html. This way we can translate the strings, and refresh the data without reloading the screen.
So we can now refresh the data continually. This works, but unfortunately it uses up a lot of CPU :-/ It's disabled for now, but I might add a button to refresh or something.
Wednesday, February 17, 2010
System Activity - Detailed Process View Part 1
I've talked about features that made it into KDE SC 4.4, and completed features that are now in svn for KDE SC 4.5. So now here's a more long term feature that I've been working on.
Scripting support for System Activity. We can now write javascript script to fetch and display information about processes.
For example:

The idea is that memory usage is rarely understood. So I wanted a tool that would try to present the information as simply as possible. There's still a lot of work to do with this, and I still haven't sorted out how I want it to work fully. I was thinking of giving it tabs, with each tab presenting different information about the process. For example a tab with graphs of cpu/memory usage over time, and a tab showing the files that the process has open.
At the moment scripts are created by just creating a main.js file and that script outputs html. The trouble with this approach is that it's very difficult for translators to, well, translate the output. So instead I was thinking of doing it like ruby on rails etc, and having a .html file that would look like:
etc. Hopefully this would be fairly easy to implement, and translators would create a copy of the html file and adjust it how they want.
Does this approach sound like it might work?
Scripting support for System Activity. We can now write javascript script to fetch and display information about processes.
For example:

The idea is that memory usage is rarely understood. So I wanted a tool that would try to present the information as simply as possible. There's still a lot of work to do with this, and I still haven't sorted out how I want it to work fully. I was thinking of giving it tabs, with each tab presenting different information about the process. For example a tab with graphs of cpu/memory usage over time, and a tab showing the files that the process has open.
At the moment scripts are created by just creating a main.js file and that script outputs html. The trouble with this approach is that it's very difficult for translators to, well, translate the output. So instead I was thinking of doing it like ruby on rails etc, and having a .html file that would look like:
<h1>Process <%= process.pid %> - <%= process.name %></h1>etc. Hopefully this would be fairly easy to implement, and translators would create a copy of the html file and adjust it how they want.
Does this approach sound like it might work?
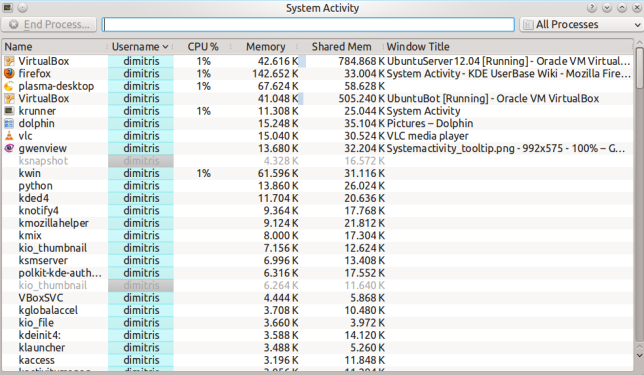
System Activity - X11 Memory
System Activity now has a column "X11 Memory" as such:

This shows the amount of pixmap memory for a process. This value will be slightly lower that the value reported by Gnome System Monitor or xrestop because those programs take almost-random guesses at how much extra memory the processes use for fonts, pixmaps etc.
I have already created a bug reported against kmix which uses 1MB of memory for its dialog box which is almost always hidden. Feel free to report bugs against other such problems :-)
Originally I thought that this feature would not be possible because xrestop uses up a lot of CPU to gather these statistics. This is because it ends up doing an O(N^2) look up of processes, requiring an awful lot of round trips to the X server. I reduced this to an O(N) lookup and got the CPU usage down to about 30ms. Considering collecting and drawing everything else takes 60ms, this is still significant so this column is not shown by default.
Also, sorry everyone for breaking the build for those of you with weird X11 installations. cmake still gives me headaches. If you have problems compiling kdebase/workspace, because of ksysguard, with the latest svn version and after doing a make clean, please tell me.
Tuesday, February 2, 2010
System Activity
Hi all!
This is my first blog to the planet, so be gentle :)
I'm maintaining "System Activity" aka "System Monitor" aka "ksysguard" aka "KDE version of Windows Task Manager". It's the thing that pops up when you press ctrl+esc or press in krunner.
For 4.4, I focused mostly stability - about a dozen bug reports were fixed. But we also have a few cool features. My favourite is actually the simplest - it shows processes that have died as grayed out. Like so:
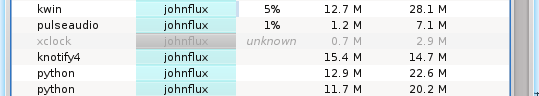
This looks really cool when you're compiling something and you can see the gcc instances coming and going.
We also have some new columns that can be shown, display I/O statistics for example. This is really cool, you can see exactly how much each process has read or written to the hard disk, with many options on how to view the information.
We also have a nice increase in speed for the graphs - that made it in just in time for 4.4. I measured an improvement from 50ms per frame to 10ms per frame for a QWidget and 15ms for a QGraphicsWidget. The process list has also seen some performance increases - nothing quite so major, but every little helps. The plasma signalplotter widget, unfortunately, doesn't benefit from this, but it will in KDE 4.5. I couldn't get this done in time.
Also I did quite a bit of polishing. Note the lack of margins in the dialog box - this requires doing a few tricks with KDialog. First, you have to force KDialog to create its inner layout by calling
Then to get a nice resize-handle grip, we have to 'trick' the QTreeView into allocating the space for it, so that the scrollbars are properly offset. Like:
This is my first blog to the planet, so be gentle :)
I'm maintaining "System Activity" aka "System Monitor" aka "ksysguard" aka "KDE version of Windows Task Manager". It's the thing that pops up when you press ctrl+esc or press
in krunner.For 4.4, I focused mostly stability - about a dozen bug reports were fixed. But we also have a few cool features. My favourite is actually the simplest - it shows processes that have died as grayed out. Like so:
This looks really cool when you're compiling something and you can see the gcc instances coming and going.
We also have some new columns that can be shown, display I/O statistics for example. This is really cool, you can see exactly how much each process has read or written to the hard disk, with many options on how to view the information.
We also have a nice increase in speed for the graphs - that made it in just in time for 4.4. I measured an improvement from 50ms per frame to 10ms per frame for a QWidget and 15ms for a QGraphicsWidget. The process list has also seen some performance increases - nothing quite so major, but every little helps. The plasma signalplotter widget, unfortunately, doesn't benefit from this, but it will in KDE 4.5. I couldn't get this done in time.
Also I did quite a bit of polishing. Note the lack of margins in the dialog box - this requires doing a few tricks with KDialog. First, you have to force KDialog to create its inner layout by calling
minimumSizeHint(), before setting the contents margins to 0. Like so: (void)minimumSizeHint(); //Force the dialog to be laid out now
layout()->setContentsMargins(0,0,0,0);Then to get a nice resize-handle grip, we have to 'trick' the QTreeView into allocating the space for it, so that the scrollbars are properly offset. Like:
    myTreeView->setCornerWidget(new QWidget);
setSizeGripEnabled(true);Sunday, December 3, 2006
Subscribe to:
Posts (Atom)